Editors Picks


The Enigma Named - MS Dhoni
23 August, 2024
/
4 Mins
Exclusive: It Feels Like I Have Won - Naman Ojha On Madhya Pradesh's Maiden Ranji Trophy Triumph
23 August, 2024
/
6 Mins
A Look At The Indian Playing XI In Virat Kohli's First Test As A Captain: Where Are They Now?
23 August, 2024
/
6 Mins
IND vs SA: Most Test Losses By Indian Captains In South Africa
23 August, 2024
/
3 Mins
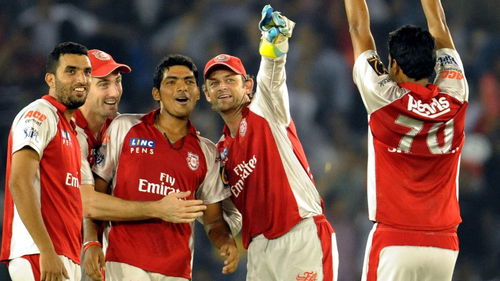
5 Lesser-Known Players You Didn’t Know Have Played For Punjab Kings
23 August, 2024
/
3 Mins
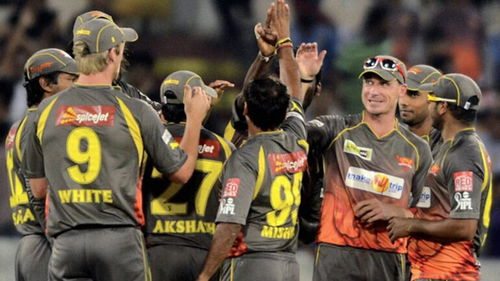
5 Lesser-Known Players You Didn’t Know Have Played For Sunrisers Hyderabad
23 August, 2024
/
3 Mins
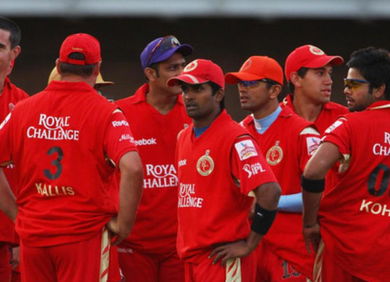
5 Lesser-Known Players You Didn't Know Have Played For Royal Challengers Bangalore
23 August, 2024
/
3 Mins
5 Lesser-Known Players You Didn’t Know Have Played For Delhi Capitals
23 August, 2024
/
3 Mins
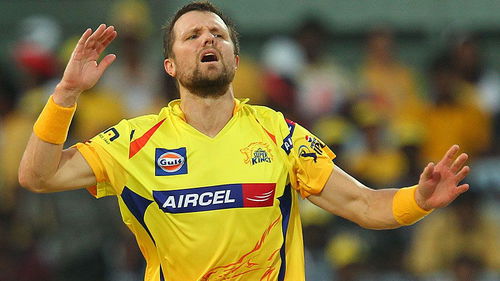
5 Lesser Known Players You Didn't Know Have Played For Chennai Super Kings
23 August, 2024
/
3 Mins


